
The numbers behind the application
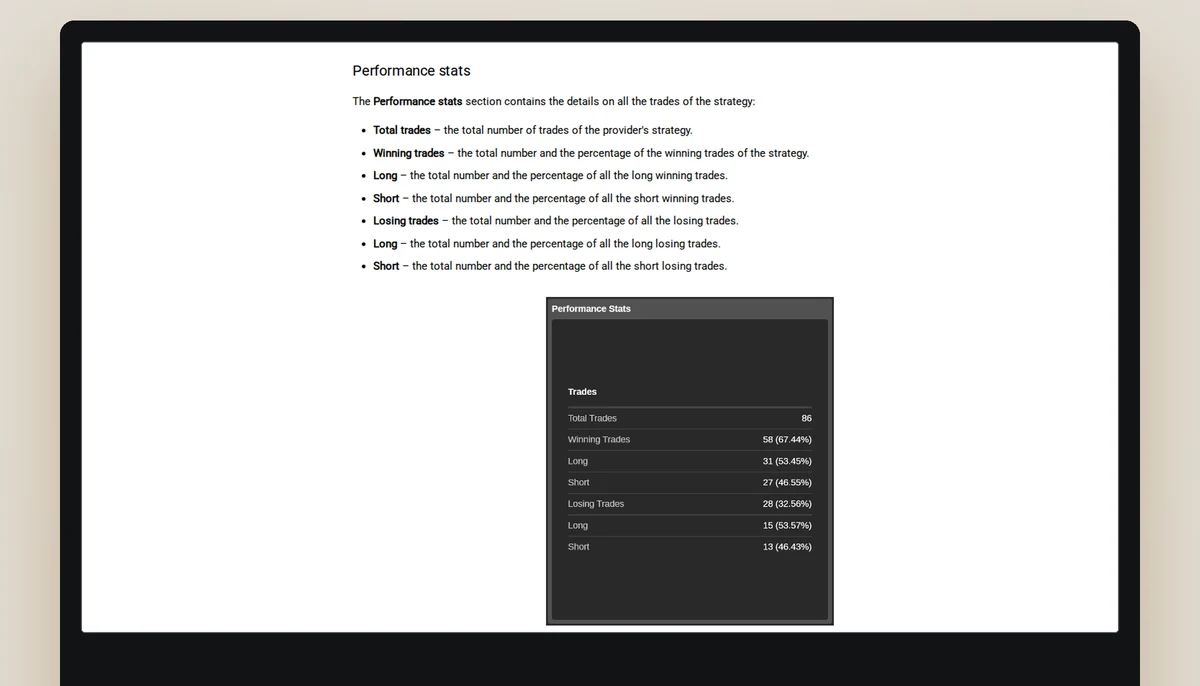
A win rate, a drawdown and a trade history are what a skeptical reader wants to see. On cTrader Copy they sit inside the application, behind a login, and this site did not read them for any card. This page does what the public pages allow: it defines them as the help pages do, read on 6 November 2026, and shows with invented numbers how they can disagree.
What is out of scope here
The Summary, Performance stats and Trades sections of a strategy page hold percent profitable, profit factor, maximum balance drawdown, total trades, the largest winning and losing trades and the average trade. The front page of cTrader Copy lists the first, the second and the drawdown among its key metrics, and says in its own questions that profit factor "is best reviewed together with drawdown and trading history". None of these is on a public page for any of the twenty cards, so this site prints none of them and does not estimate them from the curves.
That is a limit, stated here once: no figure on this site is a win rate, a drawdown or a profit factor of any provider.
Five figures the help pages define, in their own words
The figures a skeptical reader asks for first are defined on the strategy page of the help centre. The right column is shortened; the third says what the definition leaves open. Source: help.ctrader.com/ctrader-copy/account-and-strategy-page, read on 6 November 2026.
| Figure | What the page says | What is left open |
|---|---|---|
| Percent profitable | The number of winning trades divided by the total number of trades. | How big the wins and losses were. |
| Profit factor | The ratio of the total net profit divided by the total net loss of the strategy. | Over which period, and what "net" leaves out. |
| Max balance drawdown | The maximum percentage of balance drawdown. | How long it lasted, and how open positions moved equity. |
| Largest losing trade | The closing deal with the largest negative result throughout the strategy. | How many trades were near it. |
| Average trade | The average profit for all trades throughout the strategy. | The spread around the average. |
Invented numbers, to show the arithmetic
The following is arithmetic on invented figures, not a card. Take an account that closes ten trades. Nine win USD 10 each and one loses USD 200. Percent profitable is 9 divided by 10, which is 90%. The wins total USD 90 and the loss is USD 200, so the account is USD 110 down. Read as the help page words it, a ratio of profit to loss, the profit factor is 90 divided by 200, which is 0.45. A high percent profitable and a loss sit in the same account, because the first counts trades and ignores their size. The reverse also holds: a provider who wins four trades in ten can be well ahead if the wins are large.
The average trade for the same account is USD 11 below zero, and the largest losing trade is the one that explains it. A page that shows percent profitable alone leaves all of that out.
A drawdown, by hand
Take a balance of USD 1,000 that rises to USD 1,200 and then falls to USD 900. The drop from the high is USD 300, which is 25% of USD 1,200. It is not 30%, the drop measured against the starting USD 1,000, and the page's wording, a percentage of balance drawdown, does not tell which base it uses. The balance changes when positions close. Equity also moves with the open ones, which is why the help pages point to the equity chart for the drawdown to be expected.
Questions to put to any record that shows these figures
Over what period are they measured? Are they from a live account or a demo? Did the provider add or withdraw money during it, which the help pages say changes the follower's positions? Which symbols were traded, as the Volume breakdown would show, and is the follower's broker able to trade them? Do the figures include the fees a follower pays? The help pages define the return against the provider's own balance, and fees paid by copiers are charged to the copy account, so they are not in it.
What a public page can still tell
Three things can be read without a login: the age of a strategy, the symbols the provider lists, and the minimum investment. The next page reads them for the twenty cards. They do not answer the questions above, and this site says so rather than fill the gap.
In brief
Read next
Questions about reading a record
Where can a win rate be seen?
In the Summary and Performance stats of a strategy page inside the application. This site read no such page.
Can a provider win nine trades in ten and still lose?
Yes. Percent profitable counts trades, not sizes: nine wins of USD 10 and one loss of USD 200 is 90% profitable and USD 110 down. The numbers are invented for the arithmetic.
Is maximum balance drawdown the same as equity drawdown?
By the definitions, no: balance changes when positions close, equity also moves with open positions.
Does this site estimate these figures from the curves?
No. The curves are 29 daily points and are not a substitute.
The broker this site links to
The link on this site goes to FxPro, a broker that cTrader's own list flags as copy-enabled. What a copy gives the follower is a leveraged contract on a price and no ownership. The broker's terms come before any decision.