
What a provider's record is, field by field
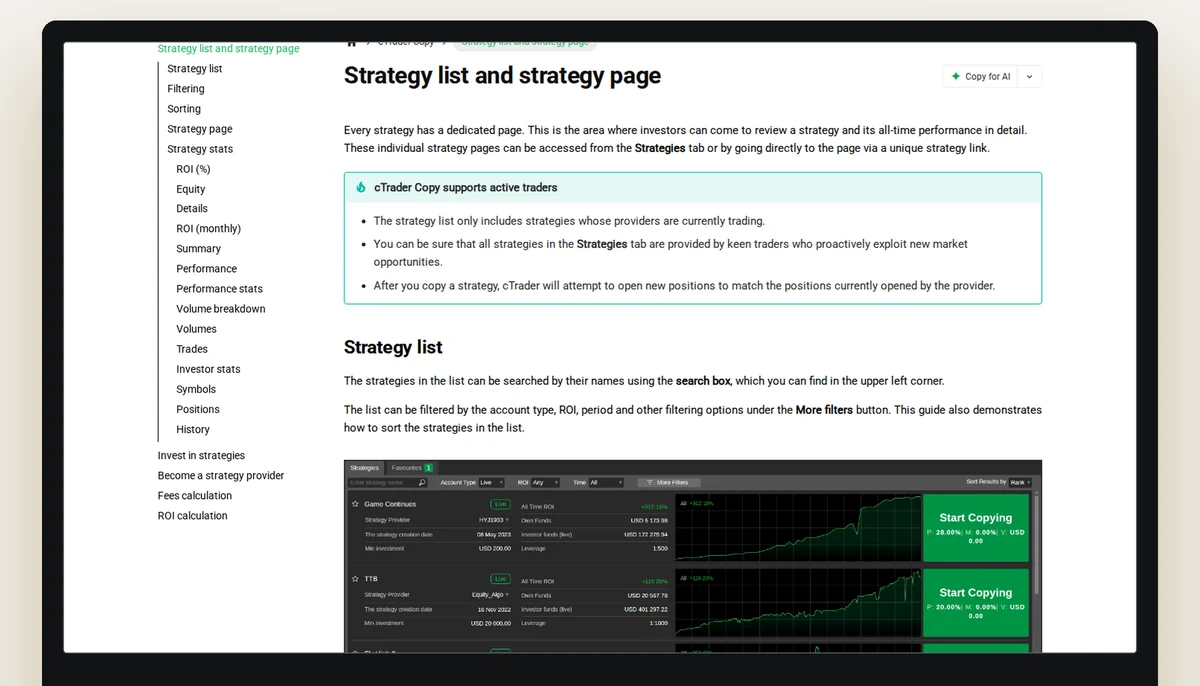
A provider's record is not one object. On cTrader Copy it is a strategy page, a provider page and a set of charts, each with its own list of fields. This page goes through them as the help pages define them, read on 6 November 2026, and points to the words that are used for more than one thing.
The top of a strategy page
The help page lists what a strategy page summarises at the top: the provider's avatar, an account type logo, the strategy name, the provider's cTrader ID, the all-time return, the investor funds attracted, the number of investors copying, and the strategy's age from the start. A custom description written by the provider "will offer insight into the strategy advantages and conditions". That sentence is the page's own, and the description is the provider's text, not a measurement.
The account type logo is where live and demo are told apart. The help page says demo strategies carry a blue Demo icon and live strategies a green Live icon. The card data this site read from the symbol pages has no field for the account type, so for the twenty cards on those pages this site cannot say which are live and which are demo.
The provider page
Selecting the provider's ID opens a second page with the provider's statistics: total investor funds (live), active since, average profit, investors over all time, investors now and active live investors. "Average profit" is defined as the average profit of all the provider's strategies, which is a figure across strategies. It is not the average profit of a trade; that is a different line, "Average trade", in the trades statistics.
Three places that print "Active since"
The same two words are defined three times on the help pages, each time for a different thing. Source: help.ctrader.com/ctrader-copy/account-and-strategy-page and help.ctrader.com/ctrader-copy/investing-in-strategies, read on 6 November 2026.
| Where it appears | What the help page says it is |
|---|---|
| The provider's statistics | The date when the provider started providing their first strategy. |
| The Summary section of a strategy | The date when the strategy was provided for copying. |
| The Summary of a copy-trading account (an investor's own page) | The time when the copy-trading account was created. |
Why the same words matter
A reader told that a provider has been active since a date has to ask which of the three that is. A provider can have started years ago, while the strategy on screen was provided for copying a few months ago, and a copy account has its own start again. The strategy's age at the top of the page is counted "from the start"; the cards on the symbol pages print a creation date, and the next page of this site uses it.
Three places that print a drawdown
The same idea appears with three different wordings. Source: help.ctrader.com/ctrader-copy/account-and-strategy-page, help.ctrader.com/ctrader-copy/investing-in-strategies and the front page ctrader.com/copy, read on 6 November 2026.
| Where it appears | Wording on the page |
|---|---|
| Front page, list of key metrics | "Max drawdown: largest balance drop over the selected period". |
| Strategy page, Summary and Trades | "Max balance drawdown" or "Maximum balance drawdown": the maximum percentage of balance drawdown. |
| An investor's own Trades table | The maximum amount of balance drawdown based on the end-of-day balance. |
What the charts are
The help page names five groups of charts: ROI, equity, performance, volume breakdown and investor statistics. The ROI chart plots time against the return in percent, "in relation to the account balance the strategy had at the beginning of the period", with periods from one week to all time, and is updated daily. The equity chart plots time against a cash value and indicates the changes in account equity concerning the account balance over the chosen period; the page calls it "particularly important to understand the strategy risk factor and what drawdown can be expected". A monthly return chart shows the return generated each month since the account was created.
What the page leaves to the application
The Summary, the Performance stats and the Trades table hold the figures that a skeptical reader asks for first: percent profitable, profit factor, the maximum balance drawdown, the largest losing trade, the average trade duration. They sit inside the application, behind a login. This site reads public pages only, so for none of the twenty cards does it hold any of them. The page on those figures defines them, which is as far as the public pages go.
In brief
Read next
Questions about reading a record
Is a provider's record one page?
No. The help pages describe a strategy page, a provider page and the charts, each with its own fields.
What does "active since" mean?
It depends on where it is printed: the provider's first strategy, the strategy being provided for copying, or the creation of an investor's copy account.
Is the provider's description a measurement?
No. The help page calls it a custom description, written by the provider.
Can this site say whether a card is live or demo?
No. The card data read has no such field. In the application a blue Demo icon and a green Live icon mark the two.
The broker this site links to
The link on this site goes to FxPro, a broker that cTrader's own list flags as copy-enabled. What a copy gives the follower is a leveraged contract on a price and no ownership. The broker's terms come before any decision.