
Reading the small curve on a card
Each card draws a curve of 29 daily points next to the printed return. This page says what the help pages define for the two big charts on a strategy page, then reads the small curve card by card. The curve is short, so the page uses it to show how falls are read, not to judge anyone. Read 6 November 2026.
Two big charts that answer different questions
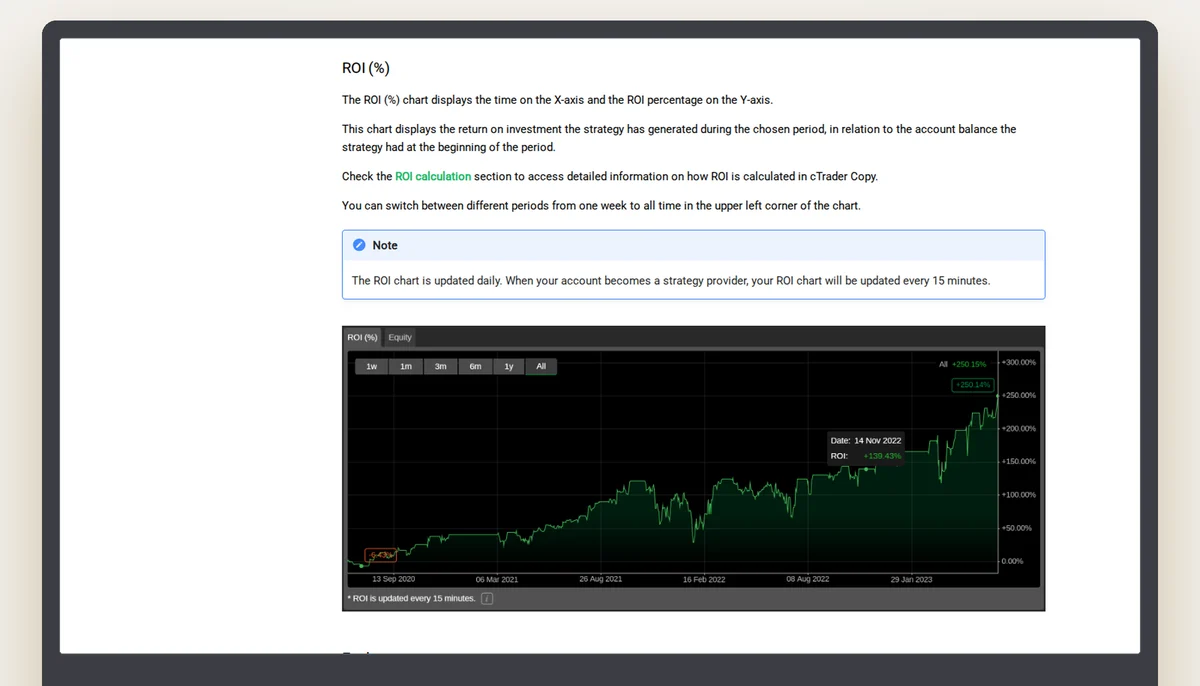
The return chart shows how much the strategy has made, measured against the balance it had when the period began. The equity chart shows the account's equity against its balance over the period; the help page says it matters for the risk factor and the drawdown to be expected. One chart answers how much, the other how rough the way was. A figure that only shows the first leaves out the second, and a reader looking at a return alone cannot see a deep dip that was later recovered.
The help page also gives a monthly return chart, one bar a month since the account was created. A single strong month and a flat remainder look the same in an all-time return as a steady record; the monthly view is where they differ.
What the small curve is
The curve on each card has 29 points, one a day from 8 October 2026 to 5 November 2026; the first point is 0 on 7 of the 20 cards, so a curve does not always begin at zero. It is the last four weeks, not the life of the strategy: a card created in 2023 and a card created in September 2026 are drawn over the same window. The largest fall in the table below is this site's own calculation from those points: the biggest drop from an earlier point to a later one, checked by a second script that tries every pair of points.
The 29-point curve of each card, 8 October 2026 to 5 November 2026
One row per card, in creation-date order. The curve has 29 daily points; its first point is 0 on 7 of the 20 cards and another value on the rest. The columns are the lowest point, the highest point, the last point and the largest fall: the biggest drop from an earlier point to a later one. The unit is the curve's own; the data carries no axis label. Cards are in creation-date order. Read on 6 November 2026 from ctrader.com/copy/symbols (the gold, bitcoin and euro pages).
| # | Strategy | Lowest | Highest | Last | Largest fall |
|---|---|---|---|---|---|
| 1 | Empire Trades | 0.00 | +4.10 | +4.10 | 0.00 |
| 2 | The Deep Secret | -1.97 | +0.05 | -0.58 | -2.02 |
| 3 | PainGain cTrader | -3.64 | +3.91 | +3.91 | -3.88 |
| 4 | Diesel | -1.98 | +1.08 | +0.94 | -2.03 |
| 5 | CR7 | -13.66 | +2.74 | -13.66 | -16.40 |
| 6 | SMART TRADER OM | -2.36 | +1.32 | +1.14 | -2.43 |
| 7 | Rostova | -2.35 | +1.30 | +1.12 | -2.41 |
| 8 | iloveyou | +1.04 | +32.05 | +32.05 | -0.10 |
| 9 | BlackSignal | -0.33 | +11.39 | +11.39 | 0.00 |
| 10 | WriggleX5 | -14.99 | +42.89 | +42.89 | -36.79 |
| 11 | ProMax | -6.47 | +37.41 | +37.41 | -22.15 |
| 12 | ONE 9 | -6.74 | +0.01 | -4.30 | -6.75 |
| 13 | GOLD ORBIT | +1.11 | +20.00 | +20.00 | 0.00 |
| 14 | GOLD MARS | +0.98 | +14.95 | +14.95 | -0.06 |
| 15 | Smartegy Trading | -0.75 | +0.39 | -0.75 | -1.14 |
| 16 | ONE | -11.00 | +0.02 | -3.66 | -11.02 |
| 17 | Less risk it more bisquit | +1.95 | +27.06 | +27.06 | 0.00 |
| 18 | Camel | +4.03 | +112.71 | +112.71 | -3.11 |
| 19 | iloveyou so much | +3.62 | +78.71 | +78.71 | 0.00 |
| 20 | Method | +7.29 | +245.28 | +245.28 | 0.00 |
Three cards, read with the table
CR7 (husseinalmoders) printed 5,159% on the gold page, and its curve ended at -13.66, which is also its lowest point; its highest was +2.74 and its largest fall -16.40. A very large printed return and a curve that ended at its lowest point stand on one card.
WriggleX5 (RacerX5) ended at +42.89, its highest point, and its lowest was -14.99. Its largest fall, -36.79, is bigger than its lowest point, which means the curve was higher earlier in the window and then dropped. Empire Trades (LogicFX) stayed at 0 for the first days, ended at +4.10 and never dropped from an earlier high. A reader who looks only at the last column sees none of this; the table is there so that the last point is read together with the largest fall.
What the counts say
5 of the 20 curves ended below 0, 4 fell by 10 points or more, and 6 had no fall at all. The deepest fall in the table is -36.79. These counts describe four weeks on twenty cards, chosen by the platform for three symbol pages by a rule the pages do not give. They are not a statement about the strategies in general.
What a skeptical reader takes from a curve
A last point is a single day. A largest fall is a single episode. Neither says how long the recovery took, which the help pages do not tabulate; the equity chart in the application would show it. The points are also daily, so a drop and a recovery inside one day cannot be seen. And the curve is the provider's account; the follower's account starts at the day of copying, on a different balance and with fees on top.
In brief
Read next
Questions about reading a record
What do the two numbers on a card measure?
The printed return is a percentage over a period the card does not state. The curve is the last 29 days, one point a day.
How is the largest fall calculated?
As the biggest drop from an earlier point to a later one among the 29 points, recomputed by a second script that tries every pair.
Does a curve that ended low mean a poor record?
Not by itself. It is a four-week window, and this site draws no conclusion about any strategy from it.
Which chart shows risk?
The help page names the equity chart as the one that is particularly important for the risk factor and the drawdown to be expected.
The broker this site links to
The link on this site goes to FxPro, a broker that cTrader's own list flags as copy-enabled. What a copy gives the follower is a leveraged contract on a price and no ownership. The broker's terms come before any decision.